
A dashboard number that disagrees with its own list is worse than no number.

Every figure here is folded from the history at the moment you ask for it. There is no nightly job and no stored total that can drift away from the rows it links to.
41 built-in reports6 analytics panelsscheduled deliveryshare without a login
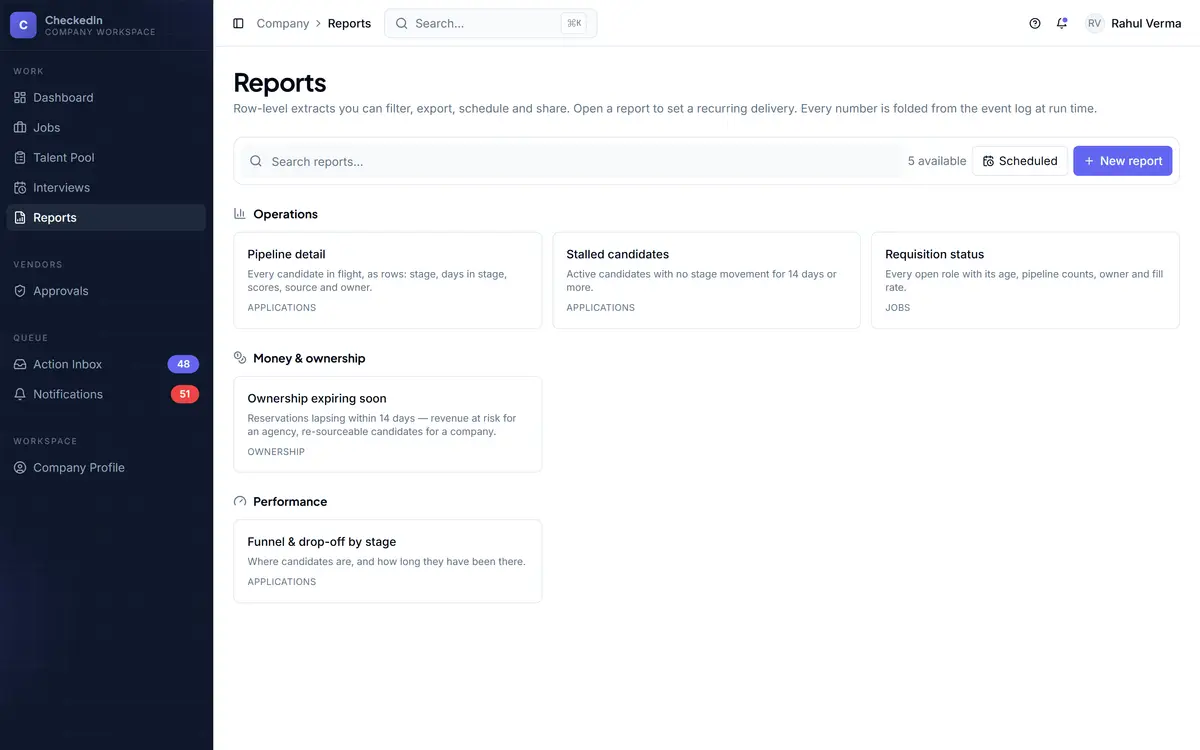
company · reports 41 BUILT-IN
The report library grouped by the decision each report serves

Real product screens. Figures shown in them are seed data from a demo workspace, not customer results.

The difference nobody draws

Analytics says how. Reports say which ones.

A chart tells you the funnel is leaking at assessment. A report gives you the eleven people currently stuck there, with their names, so somebody can do something today.

11
Operations What is in flight, what is stuck, what needs a person
12
Performance Where candidates drop out, how long stages take, which sources convert
8
Money & ownership Fees, payables, and which reservations are about to lapse
7
Governance Who changed what, consent and retention posture, audit questions
3
Executive The whole-org roll-up
41
Built and waiting Before you build a single one of your own
Worth knowing by name

Six that earn their place on a Monday.

ReportWhat it gives you 
Pipeline detailEvery candidate in flight as rows: stage, days in stage, scores, source, owner
Stalled candidatesActive candidates with no stage movement for 14 days or more
Ownership expiring soonReservations lapsing within 14 days. Revenue at risk if you are an agency, re-sourceable candidates if you are the company
Requisition statusEvery open role with its age, pipeline counts, owner and fill rate
Funnel & drop-off by stageWhere people are, and how long they have been there
Quality of hireRetention by measured-score band, which is the number that says whether measuring predicted anything
Your own

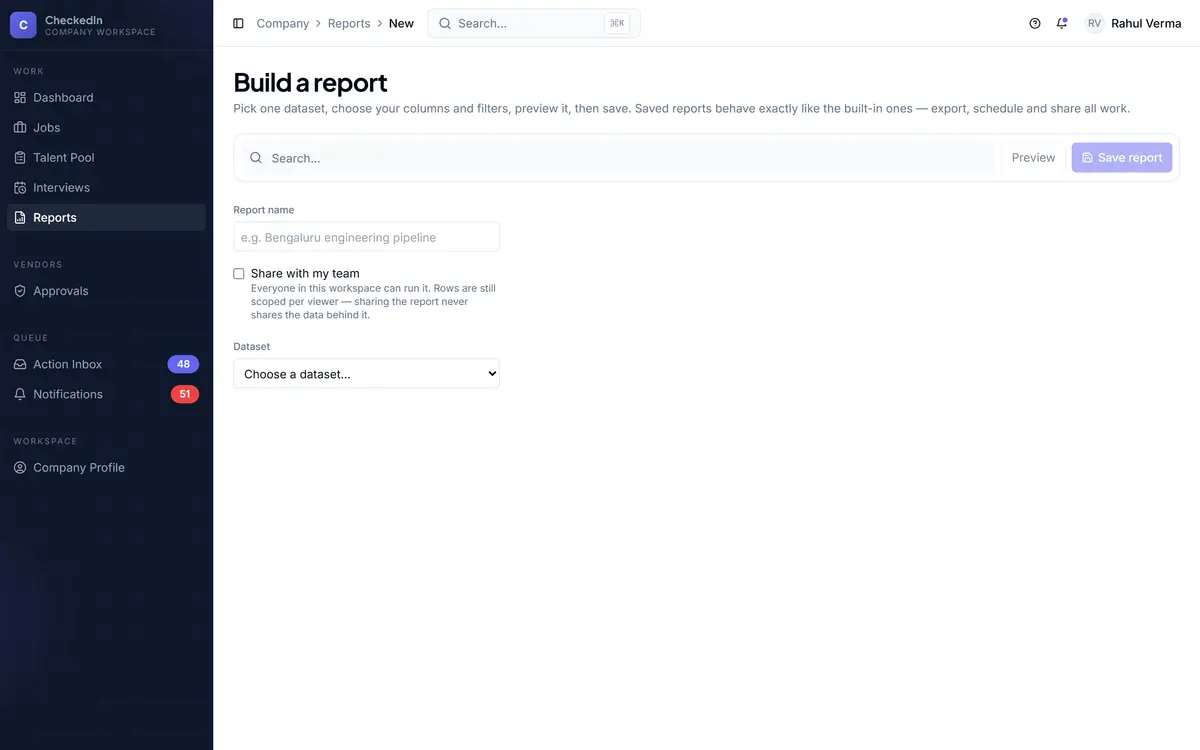
Pick a dataset, choose columns, set filters, save.

It joins the library beside the built-ins, and a saved report can be edited afterwards, so one that is nearly right does not have to be rebuilt.
Scheduled deliveryThe right home for the numbers somebody asks for every Monday. It arrives without anyone remembering to run it.
Share outside CheckedInA link for a hiring manager who does not use the system, or a client contact. No login needed at their end. Treat it as a credential: anyone holding it reads that report, including whatever candidate details its columns carry, so share the narrowest report that answers the question.
company · report builder YOUR OWN
The report builder, picking a dataset then choosing columns and filters
Analytics

A new metric next quarter is a replay, not a migration.

Because every number is derived from the history rather than counted alongside it, there are no separate counters to drift. Somebody asking for a figure nobody tracked is days of work, not a schema change plus a backfill script plus an apology.
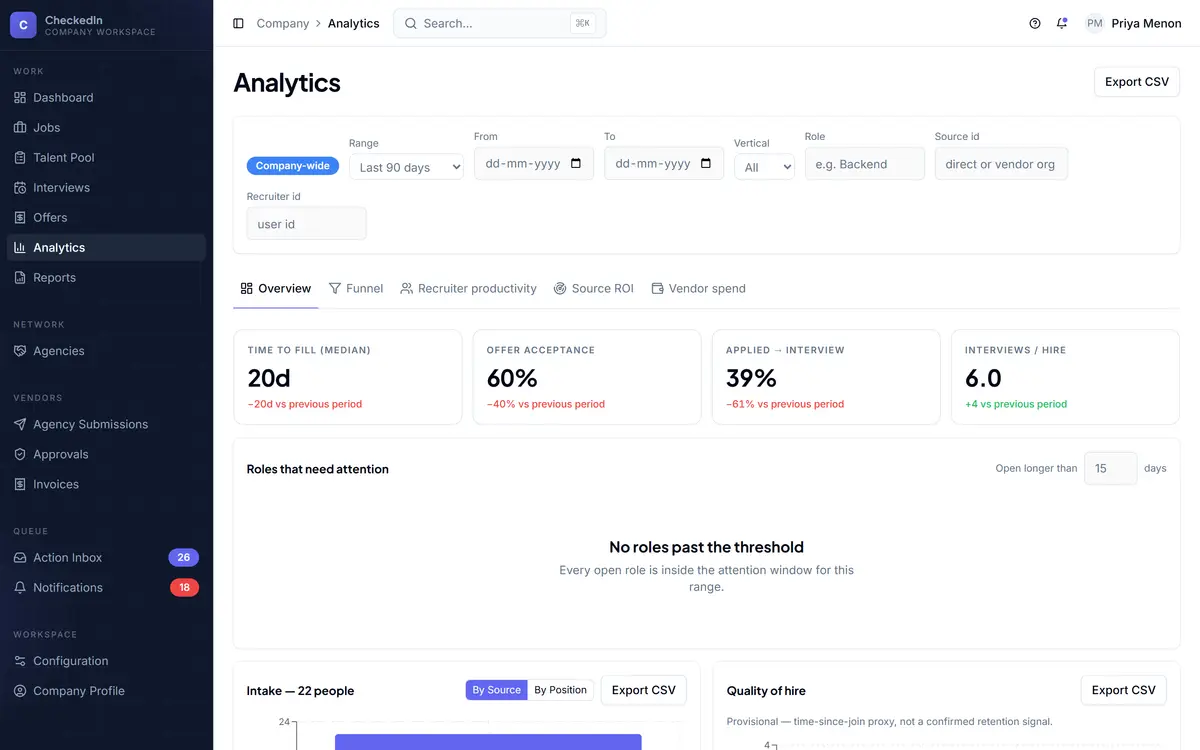
One filter bar drives every panelPeriod, vertical, role, source, recruiter. And it all exports.
Quality of hire is the honest oneRetention by measured-score band. It only works because a measured score can never be edited after the fact; if it could, the analysis would be circular.
State your endpointsTime-to-fill here is requisition opened through to a joined hire. Most of the market measures opened through to offer accepted. Those are different numbers.
company · analytics 6 PANELS
The analytics view, with funnel and velocity panels driven by one filter bar
What this part does not do

Worth knowing before the demo, not after.

Reports is a separate grant from Analytics a recruiter often has one and not the other
No BI-tool connector or warehouse sync export, or use a share link
No diversity reporting on declared demographics grouped by classification tags, deliberately
No custom SQL or arbitrary joins pick a dataset, columns and filters
A share link is a credential anyone holding it reads that report
Scheduled delivery needs the worker process if it stops, nothing arrives
Book a demo